3. Viewing my data
Once you’ve linked your sensor, you can view the data it’s collecting.
1. From the My Smart Sensors screen, you will see your linked sensor in the list. Simply tap it to view the Summary screen.
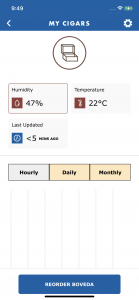
2. The Summary screen displays the current temperature and humidity at the top.
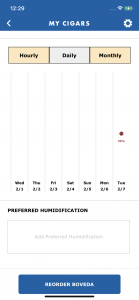
3. At the bottom of the Summary screen, you can see your historical data on the graph.
4. Tapping the Humidity and Temperature at the top of the page will toggle between your historical temperature and humidity measurements on the graph. You can select hourly, daily, or monthly to change the granularity of the plot. The graph displays the average reading for the time period. For Impacts, a list of the impact readings will be displayed when tapping the Impacts button.